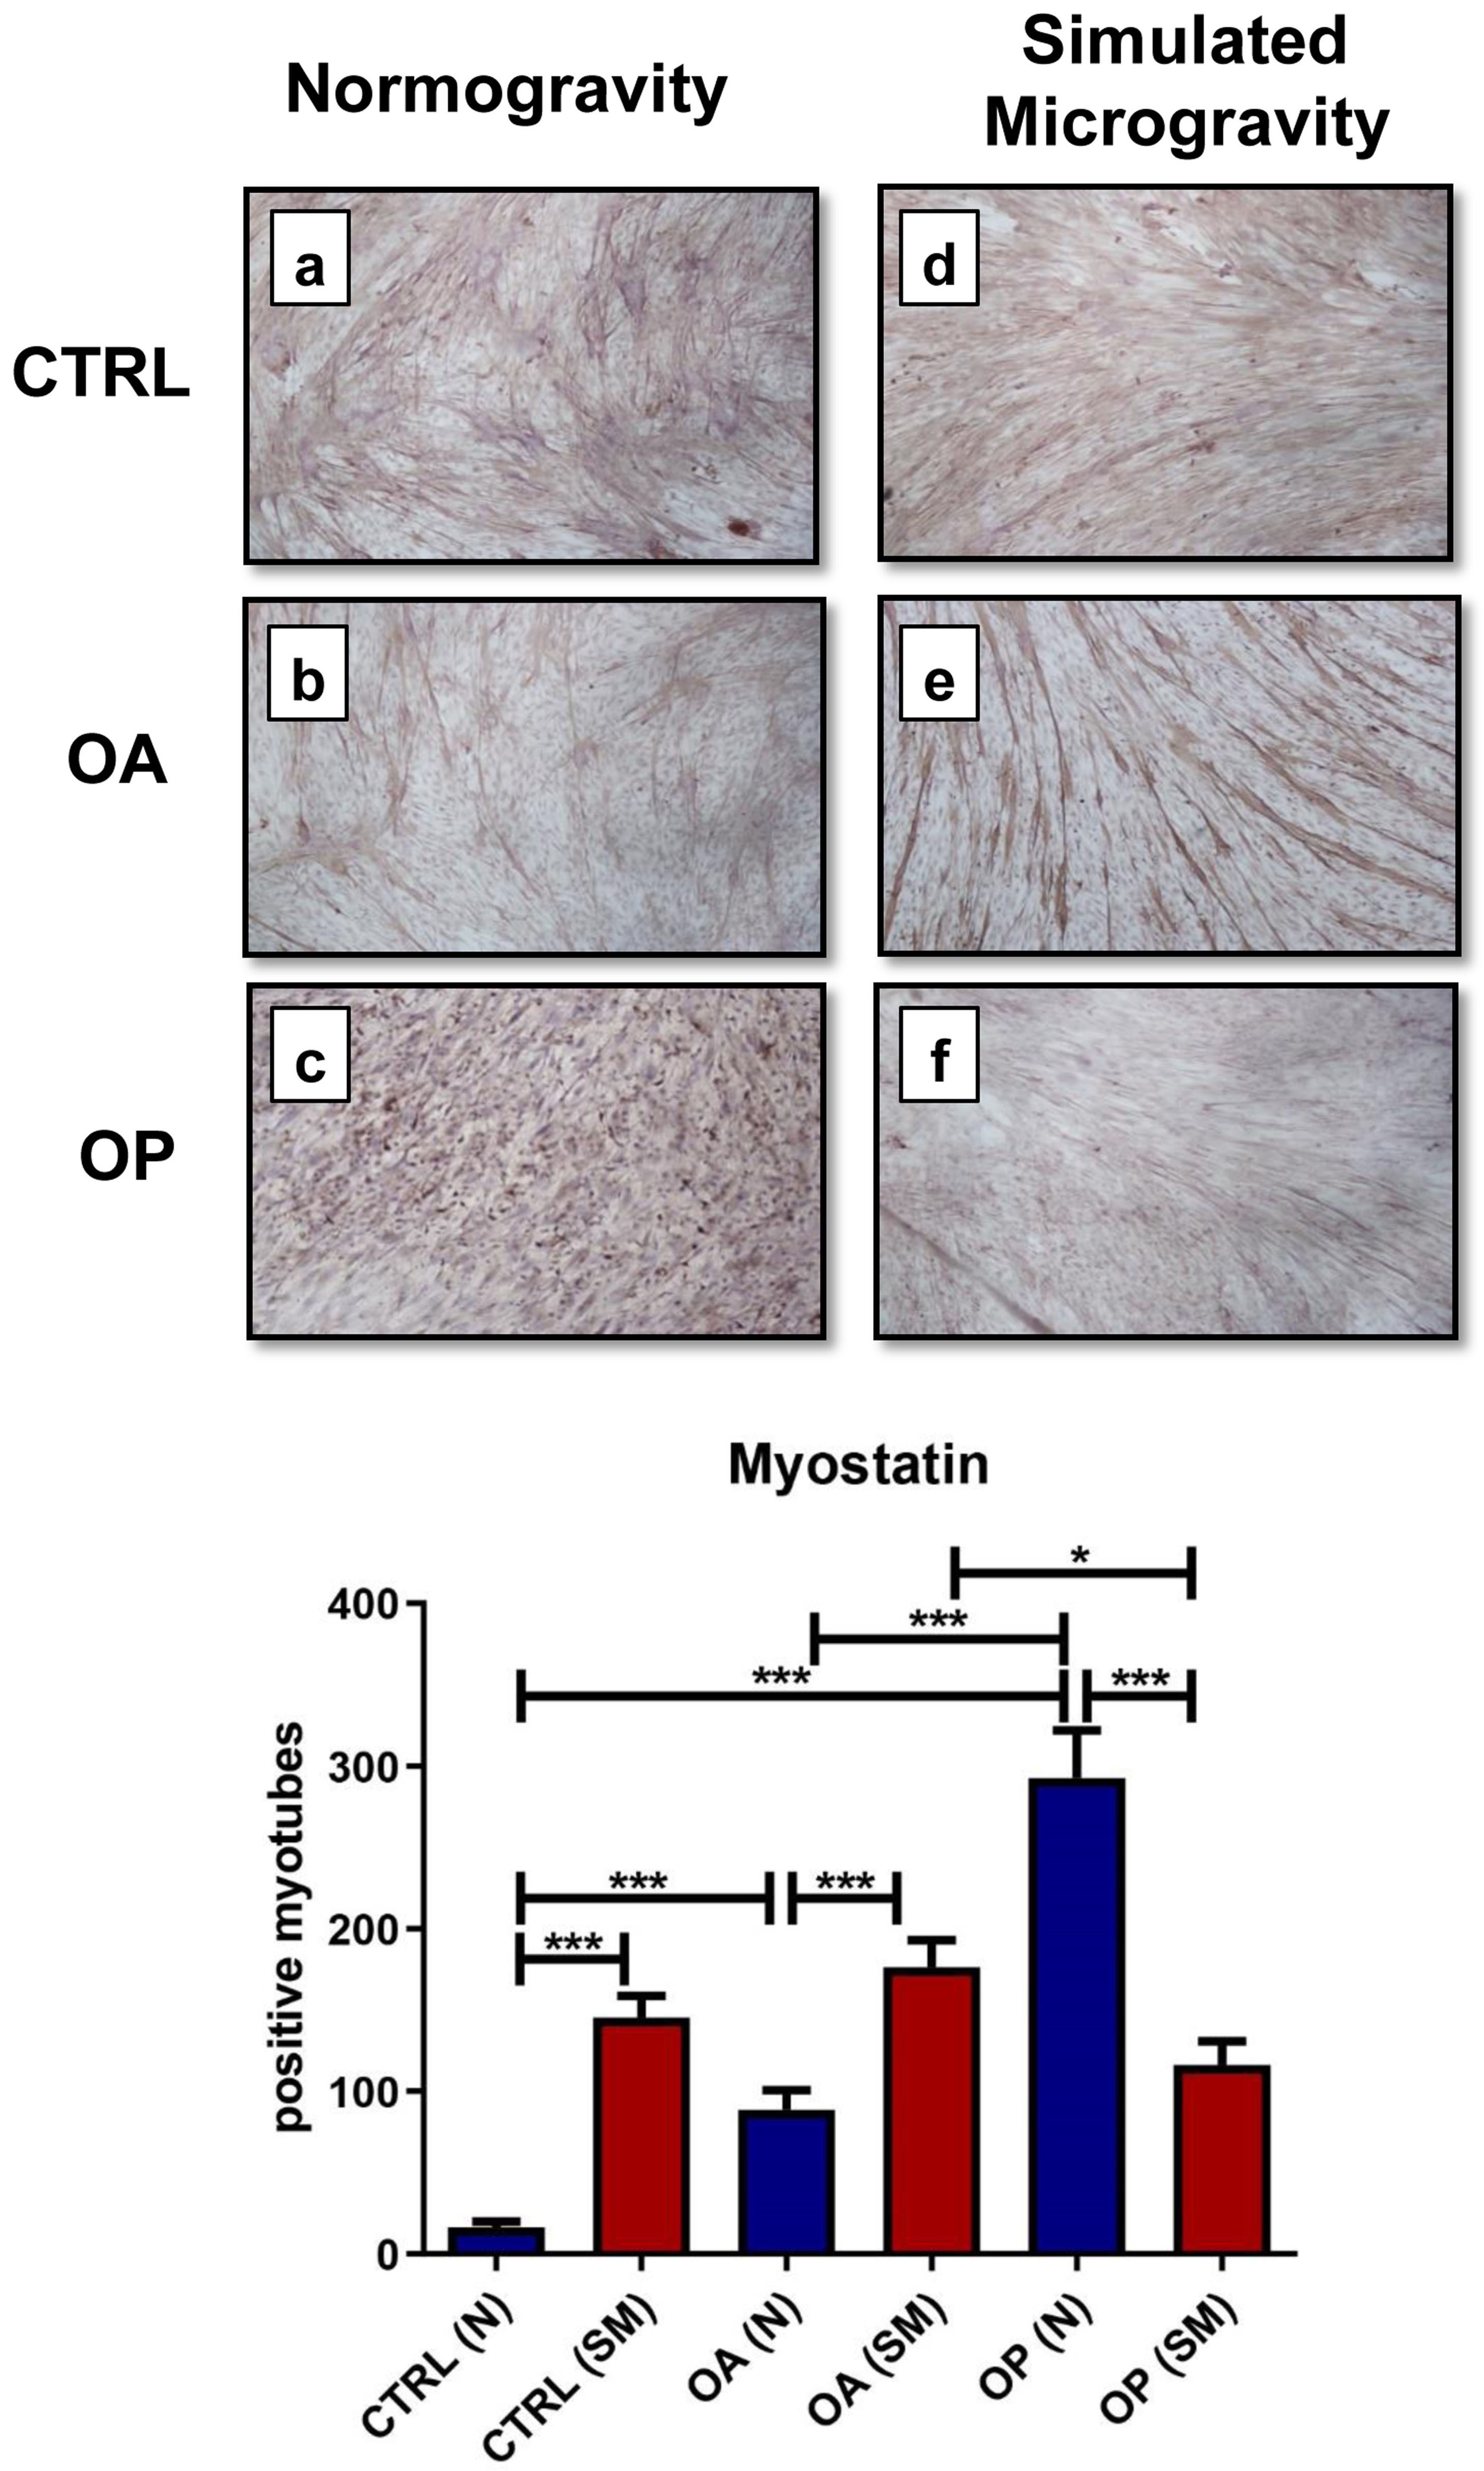
Fig. 4. Evaluation of myostatin expression. In normogravity conditions, a significant increase in myostatin expression in primary cultures of OP and OA patients respect to CTRL patients (OP 292.4 ± 29.4 vs OA 88.6 ± 12.1 vs CTRL 16.3 ± 3.5) was observed (OP vs OA, OP vs CTRL and OA vs CTRL, p<0.0001). In simulated microgravity conditions, a significant reduction in myostatin expression in OP patients (116.2 ± 14.4) was observed, while higher levels of myostatin expression in both CTRL (145.2 ± 13.5) and OA patients (176.1 ± 16.8) were found (OA vs OP, p<0.05). Note that a significant statistical difference was reported between the two CTRL groups (p<0.0001), the two OA groups (p<0.0001), and the two OP groups (p<0.0001). For each patient, the experiment was conducted in triplicate (n=27/group).